"July Sees Modest Rise in Schwab Trading Activity Index: What It Means for Investors"
A Modest Surge in Trading Activity: What July's Schwab Trading Activity Index Reveals
In the intricate web of financial markets, trading volumes act as a vital pulse, indicating investor sentiment, market momentum, and economic health. The Schwab Trading Activity Index (STAI) for July recently revealed a modest uptick, sparking discussions among investors about the implications for market dynamics moving forward. Why should you, as an investor or trader, care? As the market navigates a complex landscape of economic indicators, geopolitical tensions, and shifting monetary policies, understanding these subtle changes can provide the clarity needed to make more informed decisions.
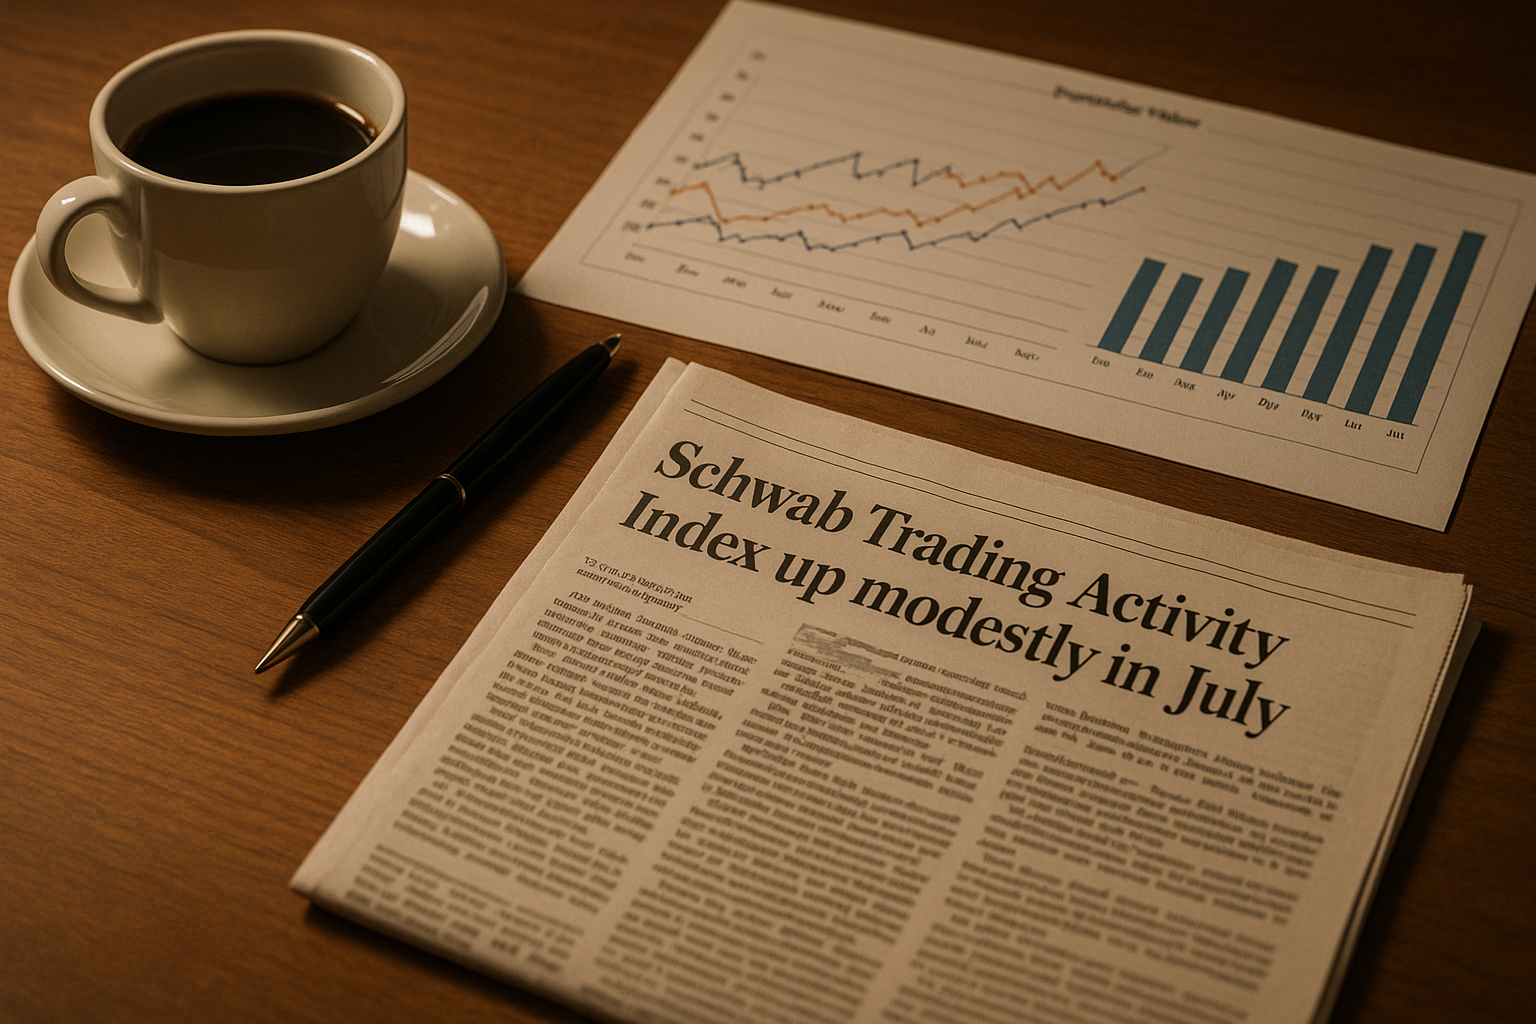
In July, the STAI rose by a noteworthy 5% compared to the previous month, suggesting that investors were becoming increasingly active in response to evolving market signals. This uptick is not merely a number; it represents shifting tides in investor confidence, market participation, and trading strategies. With the backdrop of a complex economic environment, what does this mean for you? Let's unpack this development in detail.
Key Developments
- The Schwab Trading Activity Index increased by 5% in July, indicating heightened investor engagement.
- Despite the uptick, trading volumes remain below historical averages, suggesting a cautious approach among investors.
- Retail trading has shown resilience, with notable participation in options and ETFs.
- Market volatility remains a critical factor, influenced by ongoing global events and monetary policy shifts.
Deep Dive Analysis
As we delve deeper into the July performance of the Schwab Trading Activity Index, it’s essential to contextualize these figures. Historically, the STAI has served as a barometer of retail investor activity, and its movements can often foreshadow broader market trends. The July increase might appear modest at first glance, but it is crucial to recognize the undercurrents driving this change.
Trading volumes saw a surge amid a backdrop of economic uncertainty characterized by mixed signals on inflation and employment. Interestingly, July’s figures reflect a notable divergence from the previous months, where trading activity had trended downwards. This shift could be attributed to several factors, including the Federal Reserve’s ongoing adjustments to interest rates, which have remained a critical focal point. As the Fed seeks to balance inflation control with economic growth, investors are acutely aware of the potential implications for their portfolios.
Furthermore, July's trading activity was also buoyed by a resurgence in the popularity of exchange-traded funds (ETFs) and options trading. According to recent data, retail investors have increasingly turned to these instruments, indicating a shift in strategy as they seek to capitalize on market volatility. For example, options trading volumes increased significantly, with retail investors making up a larger share of total trades. This trend reflects a growing sophistication among retail traders, who are now more equipped than ever to navigate the complexities of the market.
However, on the flip side, while the increase in trading activity is noteworthy, it is crucial to confront the reality that volumes remain below historical averages. This suggests a lingering caution among investors. They are not diving headfirst into the market; instead, they are adopting a more measured approach. In financial terms, this could indicate that many investors are still grappling with uncertainty, likely stemming from geopolitical tensions, fluctuating commodity prices, and the unpredictable nature of global markets.
Market Impact & What It Means For You
So, what does this all mean for individual investors? For one, the modest increase in trading activity could signal broader market trends that you may want to capitalize on. If you’ve been considering entering the market or adjusting your investment strategy, now may be the time to reevaluate your positions. The uptick in trading activity could suggest that more investors are becoming optimistic or are at least seeking to be more active in their investments.
Moreover, if you are involved in options or ETFs, the increased participation in these markets could present opportunities for strategic plays. Given the higher volumes, liquidity in these products may improve, which can be advantageous for you as a trader. Enhanced liquidity often leads to tighter spreads, allowing for more efficient trading and better pricing on your investments.
That said, it is vital to remain vigilant. The market's current volatility, coupled with the ongoing economic uncertainties, could lead to swift changes in sentiment and trading patterns. Therefore, keeping a close eye on the STAI and other market indicators will be essential in navigating these waters.
The Bigger Picture
To truly appreciate the significance of the Schwab Trading Activity Index's behavior, it’s necessary to place it within a broader historical context. The current trading landscape is reminiscent of previous market cycles, where sudden increases in trading activity were often catalysts for larger market movements—both ascendant and descendent.
Consider the period following the 2008 financial crisis. In the wake of that turmoil, retail trading surged as individual investors looked to capitalize on market volatility and recover from losses. Fast forward to today, and we’re observing a similar pattern, albeit under different circumstances. The global pandemic introduced unprecedented volatility and uncertainty in financial markets, and as economies begin to recover, we’re witnessing a renewed appetite for trading.
Additionally, the ongoing evolution of technology in trading platforms has democratized access to the markets. More investors have become empowered to participate actively, driven by user-friendly apps and real-time data availability. This transformation has not only altered market dynamics but has also contributed to the increasing complexity of trading activity, as more individuals engage in sophisticated strategies.
Expert Outlook
Looking ahead, what should you be watching for in the coming months? The trajectory of the Schwab Trading Activity Index, combined with other economic indicators, will provide valuable insights into market sentiment. If the current trend continues, we could see a more sustained recovery in trading volumes, potentially leading to increased volatility and opportunities for savvy investors.
However, the ever-present specter of economic uncertainty looms large. Ongoing discussions regarding interest rate hikes and inflation control will play a pivotal role in shaping investor behavior. Moreover, geopolitical events, such as tensions in Eastern Europe and the implications of U.S.-China relations, could further influence market activity. It’s essential to remain adaptable in your investment strategies, as shifts in these areas can lead to rapid changes in market sentiment.
As you keep an eye on these developments, consider diversifying your portfolio to mitigate risks associated with unexpected market swings. Staying informed about macroeconomic trends, alongside the nuances of trading activity, will be crucial to navigating this landscape effectively.
Frequently Asked Questions
What is the Schwab Trading Activity Index?
The Schwab Trading Activity Index (STAI) is a measure of retail trading activity, providing insights into the behavior of individual investors in the stock market. It reflects the volume of trades made by retail investors and serves as an important indicator of market sentiment.
Why is the increase in the STAI significant?
An increase in the STAI suggests heightened engagement among retail investors, which can be a precursor to broader market movements. It indicates a shift in investor sentiment, which can lead to increased volatility and trading opportunities.
How can I leverage changes in trading activity?
By keeping an eye on trading activity indicators like the STAI, you can adjust your investment strategies accordingly. Increased trading activity may signal new opportunities, particularly in options and ETFs, where liquidity might improve, allowing for more efficient trades.
Bottom Line
In conclusion, the modest rise of the Schwab Trading Activity Index in July serves as a vital indicator of shifting market dynamics. As investors become more engaged, the implications for market volatility and trading strategies are significant. Staying informed and adaptable in response to these developments is crucial for successful investing. For more insights into market trends and investment strategies, consider subscribing to our updates. Your financial future may very well depend on it.