Unveiling Market Breadth Indicators: Beyond the Surface Data
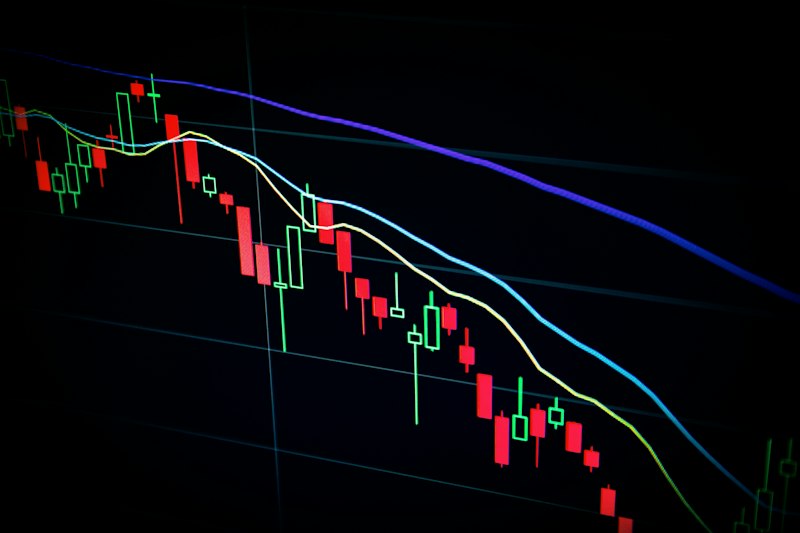
Understanding Market Breadth
Market breadth indicators are crucial for investors seeking a comprehensive view of the stock market’s health. While many focus solely on index performance, exploring breadth offers insights into the underlying strength of market movements. These indicators gauge the number of advancing versus declining stocks and can often signal market trends before they manifest in price action.
Key Market Breadth Indicators
- **Advancers vs. Decliners**: This fundamental measure compares stocks rising to those falling. For example, on a given day, if 2,000 stocks advanced while 1,500 declined, the market breadth is positive.
- **The McClellan Oscillator**: This indicator refines the advancers vs. decliners data through a moving average approach, smoothing out daily volatility. A recent reading indicated a divergence, suggesting that while major indices hit new highs, fewer stocks participated in these rallies.
- **New Highs vs. New Lows**: Tracking the number of stocks reaching new highs against those hitting new lows provides another dimension. In a bullish market, new highs should significantly outnumber new lows. A recent analysis showed that while the S&P 500 approached a record high, the new highs-to-lows ratio indicated waning momentum.
- **Advance-Decline Line**: This cumulative indicator provides a broader view over time by adding the advance-decline difference each day. A consistent rise suggests overall market strength; however, recent fluctuations have raised concerns among analysts.
- **Percentage of Stocks Above 200-Day Moving Average**: The percentage of stocks trading above their 200-day moving average serves as a barometer of overall market health. As of last week, only 55% of stocks were above this crucial threshold, hinting at potential weakness beneath the surface.
The Psychological Impact of Breadth
Market breadth not only reflects the current state of affairs but also influences investor psychology. When breadth is strong, confidence grows, often leading to increased buying activity. Conversely, weak breadth can create unease; investors may begin to question whether the rally is sustainable, which can trigger selling pressure.
Recent Trends and What They Mean
Recent data indicated a broader divergence between index performance and breadth indicators. While the Dow Jones Industrial Average surged by 5% over the last month, the number of stocks participating in this rally stagnated. This disconnect raises questions about the sustainability of current market trends.
- **Investor sentiment** is crucial: A decline in breadth often heralds market corrections. For example, in 2020, as the S&P 500 reached new highs, breadth dwindled, foreshadowing the market's subsequent downturn.
Expert Opinions
Market analysts are increasingly turning their attention to breadth indicators. Many see a shift in investment strategies towards smaller-cap stocks, which have begun to show stronger breadth compared to large-cap stocks. This could align with a broader economic recovery as consumers return to spending.
Frequently Asked Questions
**What does strong market breadth indicate?** A strong market breadth typically indicates that a broader range of stocks is experiencing upward momentum, suggesting a healthy and sustainable market rally.
**How can market breadth predict market corrections?** When breadth weakens while indices continue to rise, it signals that fewer stocks are supporting the rally, which often precedes a market correction.
**Are breadth indicators worth monitoring?** Yes, monitoring breadth indicators can provide early warning signs about potential market shifts, helping investors adjust their strategies accordingly.
The Bottom Line
Market breadth indicators offer valuable insights that go beyond superficial index performance. By examining these metrics, investors can better understand the underlying dynamics at play, allowing for more informed decisions. With recent trends hinting at caution, a discerning eye on breadth may be crucial for navigating the upcoming market landscape.