Understanding Market Volatility Index: Insights Beyond the Basics
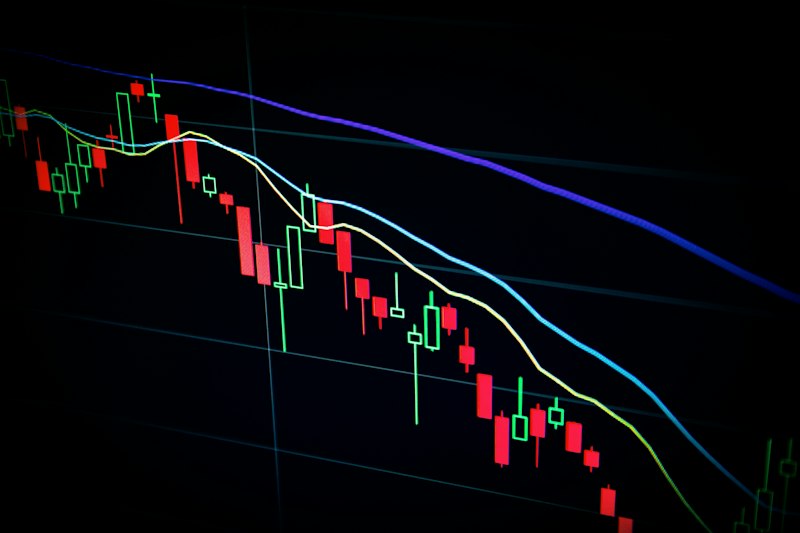
The Market Volatility Index, or VIX, often dubbed the "fear gauge," measures market expectations of near-term volatility as reflected in S&P 500 index options prices. While many investors view the VIX solely as a tool for timing market entries and exits, a deeper dive reveals intricate insights into market psychology and behavior.
The Mechanism Behind the VIX Understanding how the VIX operates is vital for investors:
- **Calculation Method**: The VIX derives its value from the prices of S&P 500 index options, representing the market’s forecast of 30-day volatility. - **Historical Context**: A VIX level below 20 typically indicates a stable or bullish market, while levels above 30 suggest heightened uncertainty.
### Current VIX Trends At the moment, the VIX hovers around 24, indicating increased investor fear. This level can be attributed to:
- **Rising Inflation**: Persistent inflation rates around 4.5% have left investors anxious about the Federal Reserve’s next moves. - **Geopolitical Tensions**: Ongoing conflicts have further exacerbated market anxieties, driving VIX levels higher.
Interpreting VIX Movements VIX movements can offer significant insights into market sentiment:
- **Correlation to Market Performance**: A rising VIX often correlates with falling stock prices; in 2023, for instance, each 5-point increase in the VIX has coincided with an S&P 500 decline of roughly 1.8%. - **Mean Reversion Tendency**: Historically, the VIX tends to revert back to its mean, often creating opportunities for savvy investors to capitalize on spikes.
### Trading Strategies Involving the VIX Smart investors often employ the VIX in various trading strategies to navigate market volatility:
- **Hedging Techniques**: Investors can use options based on the VIX to hedge against downturns in their portfolios. - **Leveraged Products**: Products like VXX allow investors to gain exposure to VIX changes, though they come with higher risks.
The Human Element: Investor Psychology Understanding the psychological aspects behind market volatility is crucial:
- **Fear vs. Complacency**: A higher VIX often signals fear among investors, while a lower VIX might indicate complacency—a dangerous combination when the market overestimates stability. - **Market Reaction Dynamics**: The VIX can spike unexpectedly due to news events, with past spikes often leading to broader market corrections.
### Future Considerations: Is the VIX a Leading Indicator? Many analysts consider the VIX a leading indicator for significant market events:
- **Tracking Historical Patterns**: During previous major market corrections, the VIX spiked dramatically before the downturns, indicating potential predictive power. - **Analytical Models**: Some traders use VIX levels to forecast potential market tops or bottoms, making it an essential tool in their arsenal.
The Bottom Line The VIX is far more than just a simple gauge of fear; it can provide critical insights for investors willing to look beyond surface-level fluctuations. By understanding market psychology and employing strategic trading methods, investors can better navigate the complexities of market volatility.
Frequently Asked Questions
**What does a high VIX level indicate?** A high VIX level typically signifies increased market uncertainty and fear, often correlating with falling stock prices.
**How can the VIX be used in trading strategies?** Investors may use the VIX for hedging or as part of speculative trading strategies to capitalize on market volatility.
**Is the VIX a reliable leading indicator?** Historically, spikes in the VIX have preceded market corrections, making it a potentially useful tool for predicting future market movements.