Understanding Market Breadth Indicators and Their Importance
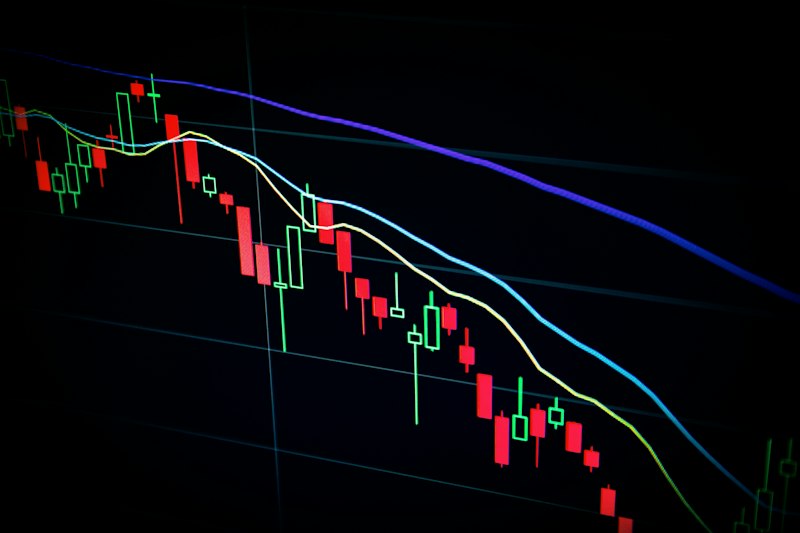
Market breadth indicators serve as a crucial aspect of technical analysis, providing analysts and traders with insights about the overall health of the stock market. These indicators measure the number of stocks advancing versus those declining, offering a perspective on market trends that goes beyond simple price analysis.
What Are Market Breadth Indicators? Market breadth indicators help investors gauge the strength or weakness of market trends by assessing how many stocks are participating in those trends. If most stocks are moving in the same direction as the major indices, it is a sign of a strong trend. Conversely, if a few large-cap stocks are driving market performance while others decline, this may indicate potential weakness.
Common market breadth indicators include:
- **Advance-Decline Line**: This tracks the cumulative difference between the number of advancing and declining stocks over time.
- **McClellan Oscillator**: A momentum-based indicator that uses the advance-decline data to assess market direction.
- **Percentage of Stocks Above the 200-Day Moving Average**: A measure that indicates how many stocks are above their long-term average price.
The Significance of Market Breadth Analysis Understanding market breadth can fundamentally alter investment strategies. For instance, during a bullish market, a healthy breadth is characterized by a high number of advancing stocks. Historical data suggests that when the Advance-Decline Line is rising, it is often a precursor to further bullish moves.
Conversely, if the major indices are reaching new highs but market breadth is faltering, it may signal an impending correction. Notably, during the late stages of the 2020 bull market, there was a noticeable divergence between the S&P 500 and the advance-decline data, leading many analysts to anticipate a market pullback.
Current Trends in Market Breadth Recent data indicates that as of October 2023, market breadth is exhibiting signs of weakness. The Advance-Decline Line has shown a divergence from major indices, particularly in the technology and consumer discretionary sectors. This discrepancy has raised concerns among traders, who argue that it could be indicative of an overheated market.
- As of recent trade, only 58% of stocks in the S&P 500 were above their 200-day moving average. - The McClellan Oscillator is currently negative, suggesting that more stocks are declining than advancing.
Breadth Indicators in Action: A Case Study A notable example of market breadth indicators in action occurred in the second quarter of 2023. During a time when the NASDAQ was rallying on the back of strong earnings from tech giants, the advance-decline ratio showed a worrying trend. Only 40% of stocks were advancing, prompting seasoned analysts to caution investors.
Investors who relied solely on index performance might have missed these critical signals and suffered subsequent losses as the market corrected sharply in July. Those who utilized breadth indicators, however, were able to hedge their positions or exit the market in advance.
Conclusion: Investing with Breadth in Mind Incorporating market breadth indicators into your trading strategy can equip you with a deeper understanding of market dynamics and enhance your investment decisions. Given the current market environment, where indices may be misleading owing to concentration in a few stocks, breadth indicators provide valuable insights that could improve performance and reduce risk.
Frequently Asked Questions
**What is the Advance-Decline Line?** The Advance-Decline Line is a cumulative indicator that tracks the difference between the number of advancing stocks and declining stocks in a specific index over time, serving as a gauge for overall market health.
**Why should I care about market breadth?** Market breadth provides insights into the underlying strength or weakness of a market trend, which can help in making informed buy or sell decisions before major market shifts occur.
**Can market breadth indicators predict market reversals?** While they cannot predict exact reversals, significant divergences between price movements and market breadth indicators can often signal potential market corrections or bullish continuations.