Exploring Market Breadth Indicators: A Fresh Perspective on Data
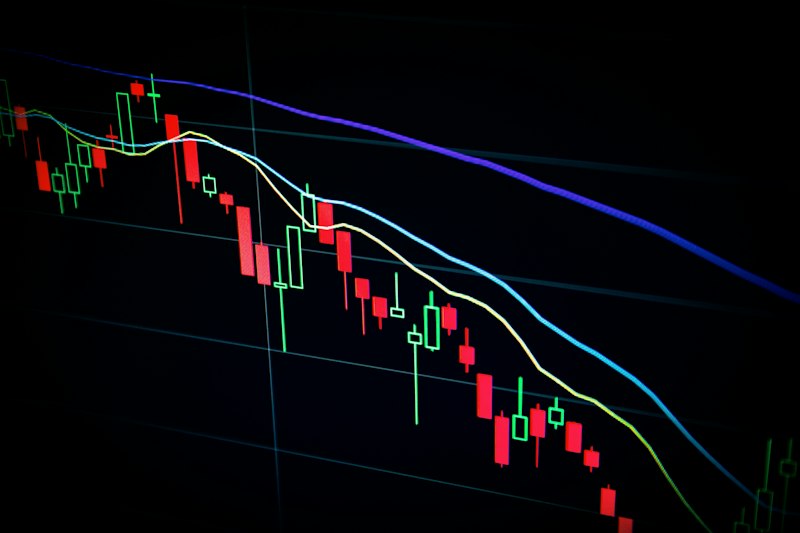
When analyzing stock market performance, most investors gravitate toward familiar metrics like the Dow Jones Industrial Average or the S&P 500. However, an often-overlooked set of indicators holds valuable insights into the overall health and future direction of the market: market breadth indicators.
Understanding Market Breadth Market breadth refers to the number of stocks that are advancing versus those that are declining. It offers a clearer picture of market sentiment than price indices alone. By looking at the overall movement of a broad range of stocks, investors can determine whether the current market trends are backed by a significant number of companies or are simply led by a few outperformers.
### Key Market Breadth Indicators 1. **Advance-Decline Line (AD Line)**: This indicator calculates the difference between the number of advancing and declining stocks. A rising AD line suggests strengthening market breadth, indicating healthy upward movement. 2. **Advance-Decline Ratio**: This simpler calculation divides the number of advancing stocks by the number of declining stocks. A ratio above 1 signifies bullish sentiment.
- **McClellan Oscillator**: This technical indicator takes the difference between two exponential moving averages of the advance-decline data. It can provide early warnings of market reversals.
### Recent Trends and Data Points As of early October 2023, the S&P 500 has consistently demonstrated a retreat in breadth. Just 54% of the stocks in the index are trading above their 200-day moving averages, a drop from 68% just a month prior. This has raised concerns among analysts who cite that such diminished breadth often precedes downturns in the market.
### Diverse Perspectives While some analysts warn of impending volatility based on narrowing market breadth, others see it as a necessary shake-up. Economic sectors like technology and healthcare have been buoying the index despite broader weakness. This divergence signals that while some stocks may be losing ground, others are still gaining traction.
### Implications for Investors For retail investors, understanding breadth indicators can help in portfolio allocation and risk management. Instead of merely tracking a few headline stocks, investors should consider the broader market landscape. Underperformance of large-cap stocks without support from mid and small caps often results in market corrections.
### Conclusion Market breadth indicators offer a nuanced look into market dynamics, serving as a guide to potential investment strategies. However, investors should remain cautious. Keeping a diversified portfolio and closely monitoring the breadth indicators can lead to more informed decisions.
Frequently Asked Questions **What are market breadth indicators?** Market breadth indicators measure the number of stocks advancing versus those declining to gauge overall market sentiment.
**Why are breadth indicators important?** These indicators reveal whether a market movement is supported by a broad base or merely a few stocks, providing deeper insights for investors.
**How can I use market breadth indicators in my trading strategy?** Investors can use these indicators to assess market strength, adjust portfolio allocations, and predict potential reversals.