Bear Market Signals: The Hidden Data That Investors Should Know
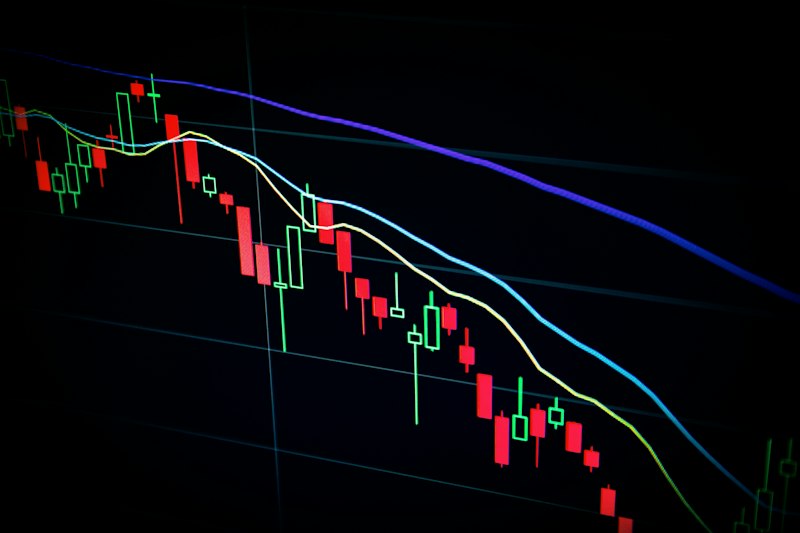
Bear markets often creep up on investors, lurking in the shadows while we remain focused on the bright side of bull markets. Understanding the subtle signals that indicate a bear market can help investors make timely decisions and protect their portfolios. In this article, we’ll delve into the lesser-known data points that suggest we could be nearing a bear market.
Defining the Bear Market: A Quick Overview A bear market is generally defined as a decline of 20% or more in a market index. The last bear market for the S&P 500 lasted from January 2022 to October 2022, and we are still feeling the repercussions.
- The S&P 500 fell nearly 25% during that period. - Signs of a new bear market often include rising volatility and diminishing economic indicators.
Understanding these markers can provide investors with advance warning.
Volatility as a Key Indicator The Cboe Volatility Index (VIX), often referred to as the “fear gauge,” serves as a barometer for market sentiment. A rising VIX indicates increased uncertainty, which often accompanies bear markets.
- Currently, the VIX has hovered around 25, higher than the historical average of 19. - A consistent rise in the VIX over several weeks could indicate that investors are bracing for a downturn.
If fear and uncertainty continue to dominate the market, we may be on the precipice of a bear market.
Economic Indicators: A Closer Look Economic indicators are another critical aspect that can signal a bear market. Analysts often look at metrics like the yield curve, unemployment rates, and industrial production for clues.
- The recent yield curve inversion—where long-term interest rates fall below short-term rates—has historically signaled recessions. - A recent report showed a spike in unemployment claims, which could foreshadow economic weakness.
These signs collectively paint a concerning picture for the economy.
Sector Performance: What the Numbers Say Not all sectors are created equal, and certain industries tend to falter before others during market downturns. Observing sector performance can provide valuable insights.
- The consumer discretionary sector has recently seen a decline of 10%, a troubling indicator as this sector often suffers during economic slowdowns. - Conversely, defensive sectors like utilities and healthcare are showing resilience, gaining around 5% over the same period.
This divergence in sector performance can be a precursor to broader market turmoil.
Behavioral Trends: Investor Sentiment Shifts Market sentiment can often be a leading indicator of market direction. A recent study by Fidelity Investments found that the percentage of bearish investors rose to 55% compared to just 30% six months ago.
- Fear-driven selling can exacerbate a downturn, creating a vicious cycle that drives the market lower. - An increase in put options, which bet against the market, has also been observed.
If more investors adopt a pessimistic view, it may signal a bear market is on the horizon.
Frequently Asked Questions
**What is the typical duration of a bear market?** On average, a bear market lasts about 1.3 years, but it can vary significantly depending on economic conditions.
**How can investors protect their portfolios during a bear market?** Diversifying investments, reallocating to defensive sectors, and considering hedging strategies can help mitigate risks during bear markets.
**What are the most reliable indicators of a bear market?** Key indicators include rising unemployment, yield curve inversions, and increasing market volatility, specifically measured by the VIX.